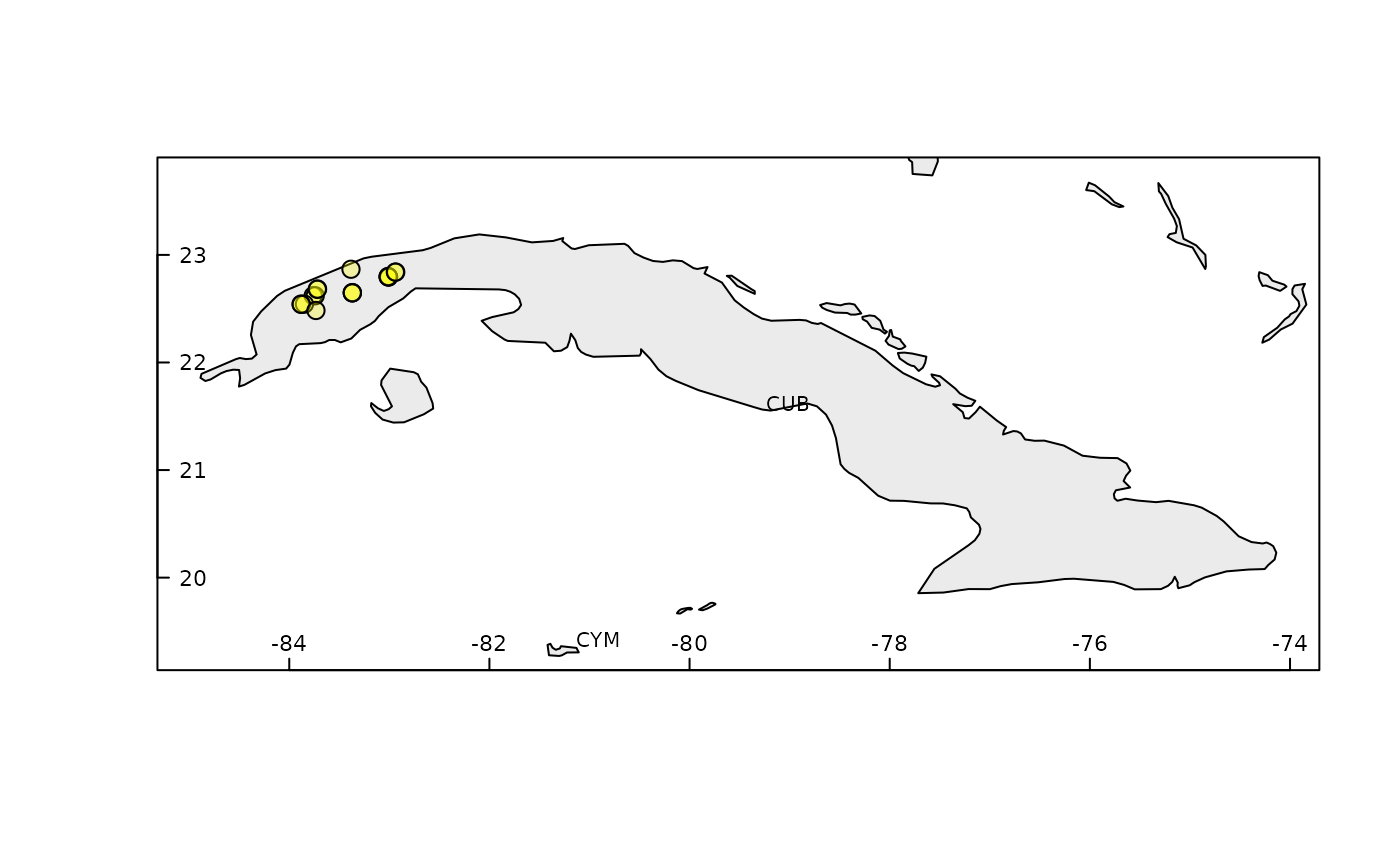
rangemap_explore generates simple figures to visualize species occurrence data in the geography.
rangemap_explore(occurrences, show_countries = FALSE, graphic_device = FALSE,
                 xlim = NULL, ylim = NULL)
Arguments
| occurrences | a data.frame containing geographic coordinates of species occurrences, columns must be: Species, Longitude, and Latitude. Geographic coordinates must be in decimal degrees (WGS84). |
|---|---|
| show_countries | (logical) if |
| graphic_device | (logical) if |
| xlim | (numeric) vector of length = 2 with the limits in longitude for
the plot. The default, NULL, uses the limits of countries with
|
| ylim | (numeric) vector of length = 2 with the limits in latitude for
the plot. The default, NULL, uses the limits of countries with
|
Value
A simple figure of species occurrences in a geographical context.
Details
Base map of countries of the world is a SpatialPolygonsDataFrame downloaded from the Natural Earth database (scale = 50).
Examples
# getting the data data("occ_f", package = "rangemap") # simple figure of the species occurrence data rangemap_explore(occurrences = occ_f, show_countries = TRUE)#> Warning: NULL source CRS comment, falling back to PROJ string#> Warning: CRS object has no comment