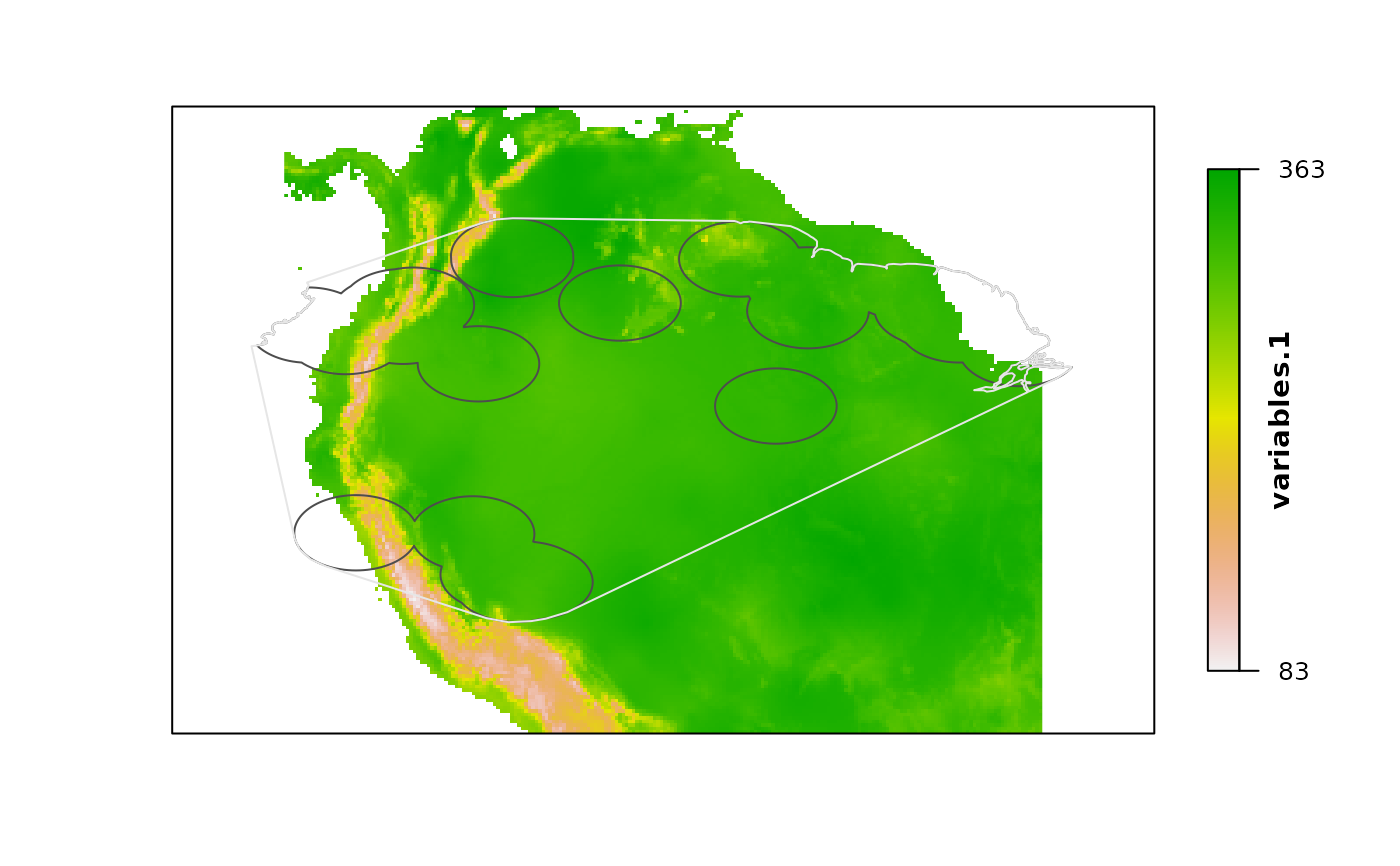
Helper to plot multiple ranges on top of environmental layers
Source:R/plotting_helpers.R
plot_ranges.RdHelper to plot multiple ranges on top of environmental layers
plot_ranges(sp_ranges, sp_records = NULL, variable, range_colors = NULL,
            color_variable = NULL, xlim = NULL, ylim = NULL)
Arguments
| sp_ranges | list of SpatialPolygonsDataFrame objects representing species ranges. |
|---|---|
| sp_records | a SpatialPointsDataFrame of species occurrences. |
| variable | a RasterLayer representing an environmental variable. |
| range_colors | vector of colors for borders of species ranges. If
|
| color_variable | a color palette (a vector of continuous colors generated
by functions like heat.colors). If |
| xlim | the x limits (x1, x2) of the plot. |
| ylim | the y limits (x1, x2) of the plot. |
Value
A plot showing species ranges on top of a environmental variable.
Examples
# example data
data("buffer_range", package = "rangemap")
data("cxhull_range", package = "rangemap")

ranges <- list(buffer_range@species_range, cxhull_range@species_range)

var <- raster::stack(system.file("extdata", "variables.tif",
                                 package = "rangemap"))[[1]]

# plotting
plot_ranges(ranges, variable = var)
